
One of the reasons I continue to place so much emphasis on market cycles is because, more often than not, they repeat with remarkable consistency. Looking at Bitcoin today, I don’t see any meaningful deviation from what we’ve experienced in previous cycles. In fact, the current cycle continues to follow the historical pattern surprisingly closely.
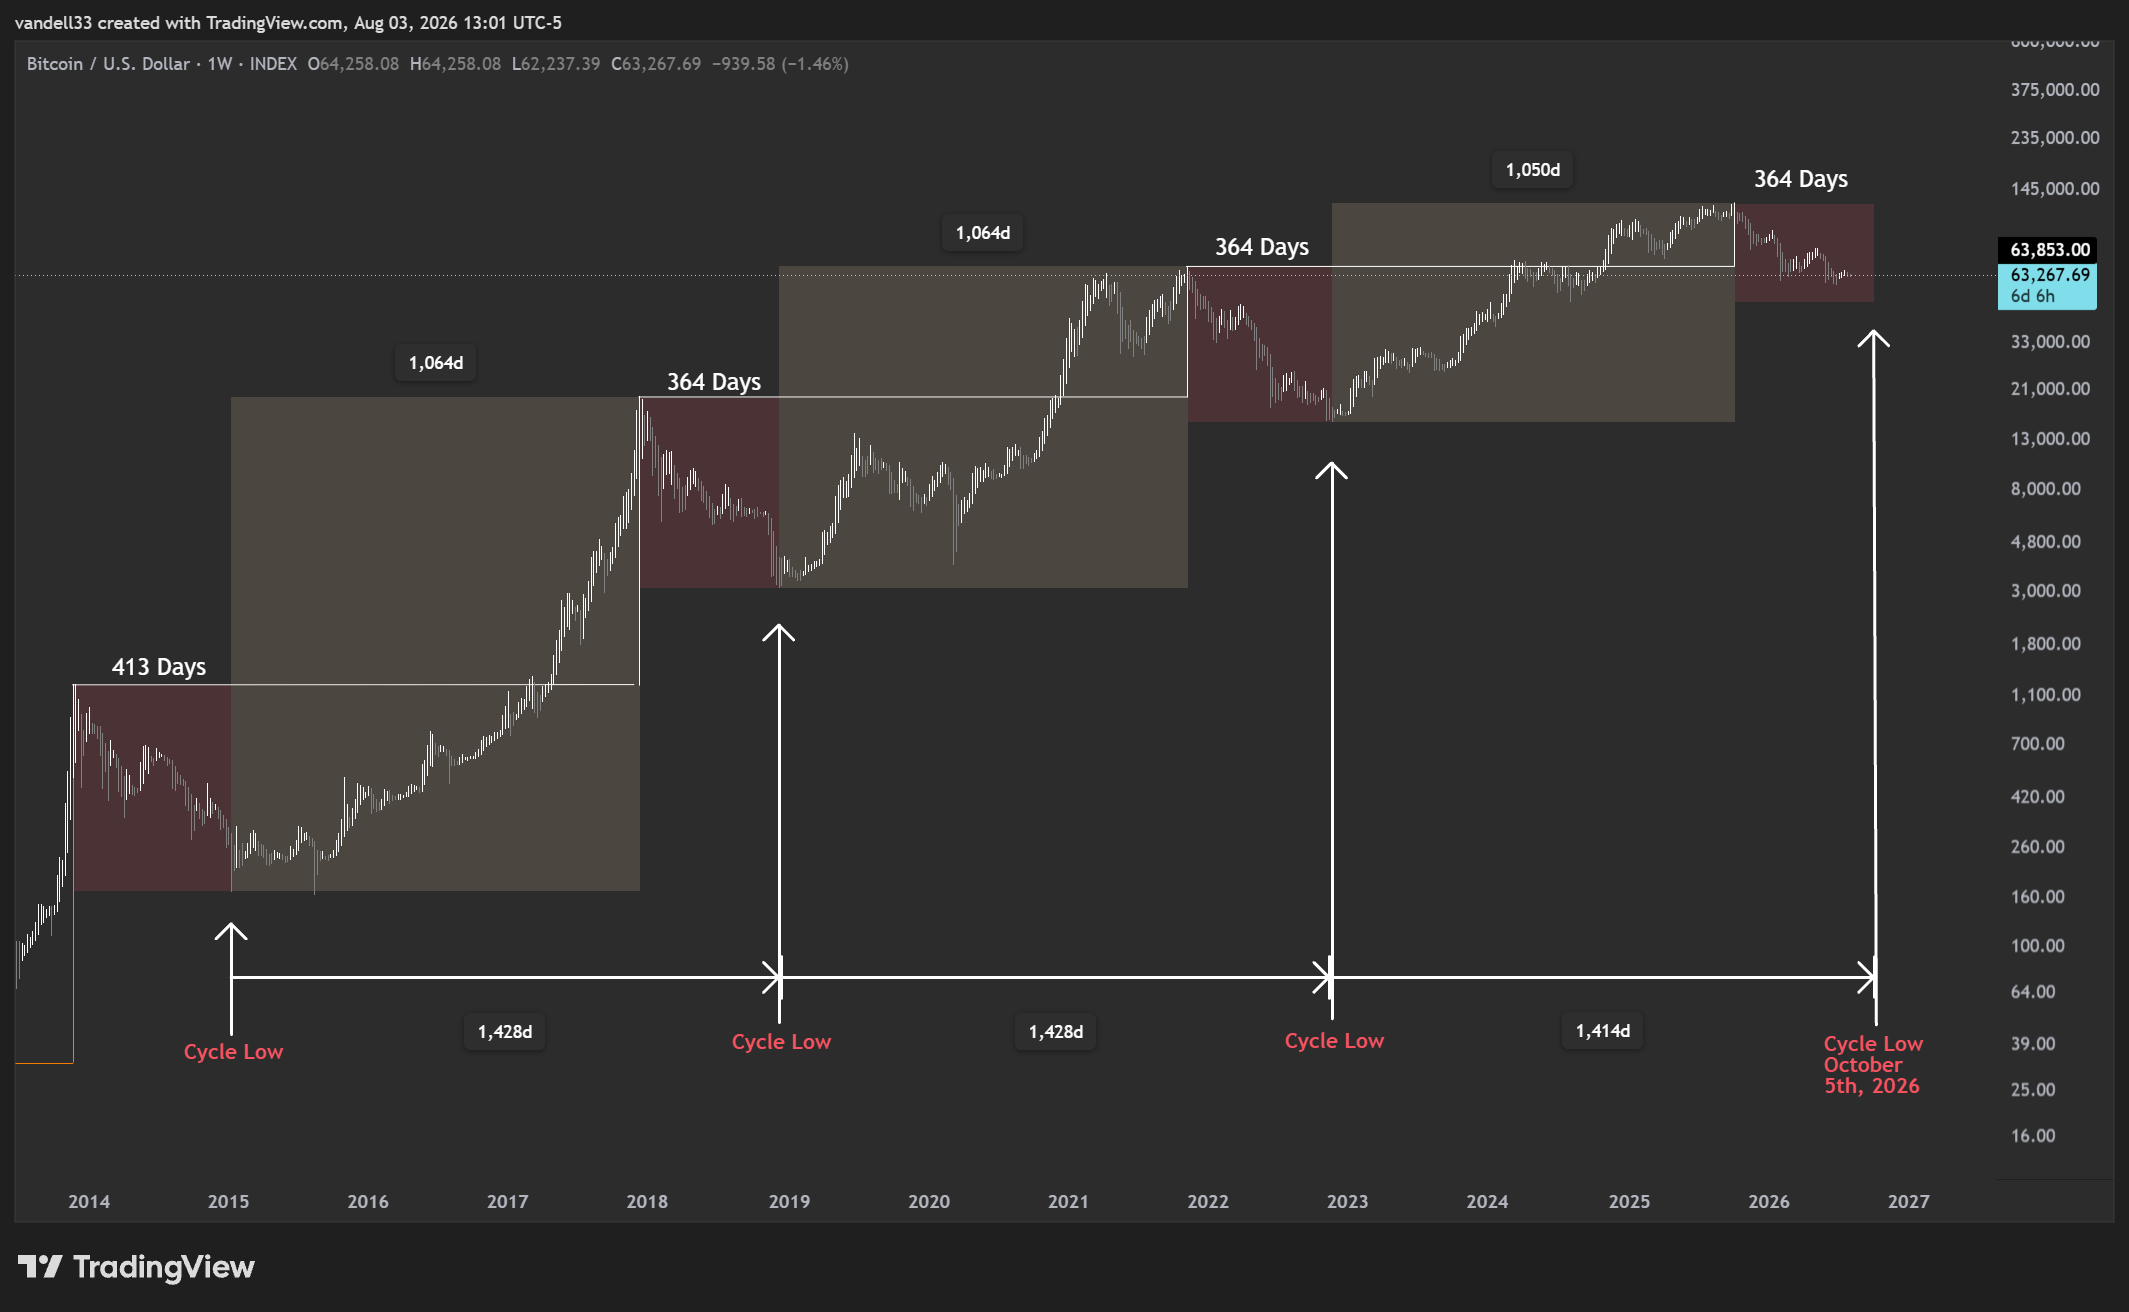
Since 2013, every Bitcoin cycle has followed a very similar rhythm. After a prolonged bull market, Bitcoin enters roughly a one-year correction before eventually finding its cycle low and beginning the next expansion phase. As you can see on the chart, those correction periods have lasted approximately 364 days, while the full cycle from one major low to the next has ranged between 1,414 and 1,428 days.
